Essential Guide to Monitoring Server Performance with Hosting Software
In the fast-paced digital landscape, server performance is the backbone of any successful online presence. Whether you’re running a small personal blog or managing a large e-commerce platform, the efficiency of your server can significantly impact user experience, search engine rankings, and ultimately, your bottom line. This is where hosting software comes into play. In this essential guide, we will explore the various tools and techniques available for monitoring server performance, helping you to identify bottlenecks, optimize resources, and ensure that your website operates at peak efficiency. Join us as we delve into the critical metrics and best practices for leveraging hosting software to enhance your server’s performance, safeguard against downtime, and maintain a seamless experience for your users. With the right knowledge and tools at your disposal, you can take control of your server’s performance and drive your digital success.
Table of Contents
- Understanding Key Performance Metrics for Server Monitoring
- Choosing the Right Hosting Software for Optimal Performance
- Setting Up Effective Monitoring Tools and Alerts
- Interpreting Data and Making Informed Decisions for Server Optimization
- In Summary
Understanding Key Performance Metrics for Server Monitoring
Monitoring server performance is crucial for maintaining the health of your IT infrastructure. Key performance metrics act as indicators of server efficiency and overall operational quality. Some essential metrics to keep an eye on include:
- CPU Usage: This shows how much of your server’s processing power is being used. High CPU usage can indicate a need for optimization or additional resources.
- Memory Usage: Monitoring RAM usage helps you determine whether your server has enough memory for your applications and services.
- Disk I/O: This metric measures the read and write operations to your disk drives, which is vital for understanding storage performance.
- Network Latency: Important for assessing the speed of data transfer between your server and its clients, helping troubleshoot network issues.
- Response Time: Measures how fast your server responds to requests, which is critical for ensuring a positive user experience.
By regularly reviewing and analyzing these metrics, you can detect potential issues before they escalate into major problems. A well-designed server monitoring approach will often include dashboards and alerts based on these metrics, allowing you to visualize your server’s performance effectively. Below is a sample overview of potential server performance metrics you may want to track:
| Metric | Ideal Range |
|---|---|
| CPU Usage | 10% – 75% |
| Memory Usage | 30% – 70% |
| Disk I/O Wait | Less than 5% |
| Network Latency | Less than 100ms |
| Response Time | Under 200ms |
Choosing the Right Hosting Software for Optimal Performance
When it comes to enhancing server performance, selecting the right hosting software is crucial. A well-chosen solution can significantly improve your site’s speed, reliability, and scalability. Key factors to consider include:
- Resource Management: Look for software that efficiently allocates CPU, memory, and storage resources.
- Compatibility: Ensure the hosting software seamlessly integrates with your existing systems and applications.
- User Interface: A user-friendly interface will facilitate easy management, enabling you to monitor performance metrics without tech overload.
- Support and Documentation: Reliable customer support and comprehensive documentation can make a big difference during troubleshooting or setup.
Additionally, the hosting software should provide robust analytics tools to help you assess performance and diagnose issues in real-time. Features worth considering include:
| Feature | Description |
|---|---|
| Real-time Monitoring | Allows you to track server health and traffic loads as they occur. |
| Alert Notifications | Sends alerts for performance dips so you can act proactively. |
| Custom Dashboards | Enables you to visualize data according to your specific needs. |
Setting Up Effective Monitoring Tools and Alerts
Implementing robust monitoring tools is crucial for ensuring optimal server performance. By using tools like New Relic, Zabbix, or Prometheus, you can gain insights into various metrics that affect your server’s health. Moreover, it is essential to put in place a system of alerts that promptly notifies you of any anomalies. Effective alerts should focus on specific parameters such as:
- CPU Usage: Set an alert for usage beyond a certain threshold to prevent server overload.
- Memory Consumption: Monitor memory usage to avoid application crashes.
- Disk Space: Alert when disk space reaches critical levels to avoid data integrity issues.
- Response Times: Keep track of server response times to ensure a smooth user experience.
To further enhance your monitoring strategy, consider implementing thresholds and escalation procedures within your alerts. Utilize a structured approach by creating a table that categorizes alerts based on their severity levels:
| Severity Level | Action Required |
|---|---|
| Critical | Immediate investigation and resolution. |
| Warning | Monitor the situation, but no immediate action required. |
| Informational | Review as part of regular checks. |
By setting up these tools and structured alerts, you ensure that not only are you aware of performance issues as they arise, but you also have a clear action path for addressing them, maintaining the reliability and efficiency necessary for your server environment.
Interpreting Data and Making Informed Decisions for Server Optimization
Analyzing server performance data is crucial in pinpointing areas that require enhancement and making strategic decisions to optimize functionality. Through in-depth monitoring, you can uncover critical metrics that reveal the health and efficiency of your servers, such as CPU usage, memory consumption, and storage capacity. Regularly reviewing this data helps identify patterns that may indicate potential issues, allowing you to take proactive measures before they escalate. Consider focusing on the following key indicators:
- Response times: How quickly server requests are processed.
- Load averages: Assessing how much work your server handles over time.
- Error rates: Keeping tabs on failed requests which could signify underlying problems.
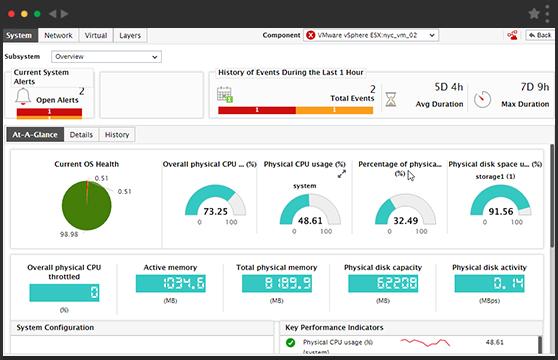
Utilizing effective hosting software enhances your ability to interpret these metrics effectively. Visual dashboards, for instance, can provide real-time insights, enabling swift decision-making. Additionally, integrating historical data analysis allows you to benchmark current performance against past trends, yielding a clearer understanding of your server’s trajectory. Here’s a simple table summarizing the benefits of various performance metrics:
| Metric | Benefit |
|---|---|
| CPU Usage | Identifies processing limits and potential bottlenecks. |
| Memory Usage | Helps in assessing whether additional resources are required. |
| Disk I/O | Monitors data read and write speeds, helps diagnose slowdowns. |
In Summary
effective server performance monitoring is not just a technical necessity; it’s a strategic advantage that can significantly impact your business operations. By leveraging the right hosting software and employing best practices, you can ensure your servers run optimally, with minimal downtime and enhanced reliability. Remember, proactive monitoring allows you to identify potential issues before they escalate, ensuring a smooth experience for your users and boosting your overall productivity.
Whether you’re a seasoned IT professional or a business owner looking to optimize your digital infrastructure, the tools and techniques outlined in this guide can help you stay ahead of the curve. As you embark on your server monitoring journey, make it a point to continually evaluate and adapt your strategies in accordance with evolving technologies and user demands.
Thank you for joining us in exploring this critical aspect of server management. Stay tuned for more insights and tips in our upcoming articles, where we delve deeper into strategies for maximizing your hosting capabilities. Your server’s performance is not just a metric—it’s the heartbeat of your business. Here’s to smoother operations and a more efficient future!